Real-Time ETL Pipeline Dashboard
Enterprise data pipeline work that turns high-volume AI call data into real-time reporting and operational insight.
Mon Oct 28 2024
Role
Full-stack platform engineer
Focus
ETL architecture, analytics APIs, dashboard data models, and operational reporting.
Impact
Powers reporting workflows over hundreds of thousands of daily calls for enterprise financial-services customers.
Building Enterprise-Scale ETL Pipelines: From Raw Data to Business Intelligence
During my time at Salient, I've architected and built ETL pipelines that process hundreds of thousands of calls daily from major US banks. These systems transform raw communication data into actionable business intelligence, powering real-time analytics dashboards used by enterprise clients.
The challenge? Processing massive volumes of unstructured data (call transcripts, metadata, customer interactions) and transforming it into structured, queryable datasets that business teams can use for decision-making.
Key Components:
- Extract: Ingest data from multiple sources (APIs, databases, file uploads)
- Transform: Clean, validate, and structure the data
- Load: Store processed data in optimized formats for analytics
Real-world Scale:
- 500K+ daily call records
- Sub-second latency requirements
- 99.9% uptime SLA
- Multi-tenant architecture
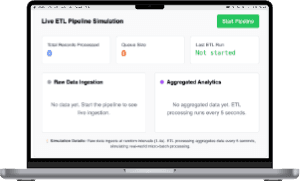
Live ETL Pipeline Simulation
Below is an interactive simulation of how our ETL system works. Watch as raw data flows in at random intervals, gets processed by our ETL engine every few seconds, and transforms into aggregated insights.
Live ETL Pipeline Simulation
Raw Data Ingestion
Aggregated Analytics
The Technical Challenge
When you're dealing with financial institutions processing thousands of customer calls daily, every piece of data matters. The raw call data comes in various formats:
- Audio metadata: Duration, quality metrics, participant information
- Transcription data: Real-time speech-to-text output with confidence scores
- Interaction events: Hold times, transfers, resolution outcomes
- Customer context: Account information, previous interactions, sentiment analysis
Here's how we transform raw call data into business insights:
Raw Input:
{
  "call_id": "call_12345",
  "duration": 420,
  "transcript": "Hello, I need help with my account...",
  "sentiment_score": 0.7,
  "resolution": "resolved",
  "timestamp": "2024-10-28T10:30:00Z"
}
Transformed Output:
{
  "hour_bucket": "2024-10-28T10:00:00Z",
  "total_calls": 127,
  "avg_duration": 380,
  "resolution_rate": 0.85,
  "avg_sentiment": 0.72,
  "escalation_rate": 0.12
}
Key Technical Decisions
1. Micro-Batch Processing
Instead of processing each record individually, we batch data into 5-minute windows. This provides the perfect balance between real-time insights and system efficiency.
2. Idempotent Operations
Every ETL job can be re-run safely. Critical for financial data where accuracy is non-negotiable.
3. Schema Evolution
Built with flexible schemas that can adapt as business requirements change without breaking existing pipelines.
4. Monitoring & Alerting
Comprehensive observability with custom metrics tracking data quality, processing latency, and system health.
Performance Optimizations
Database Design
- Partitioned tables by date for efficient querying
- Materialized views for complex aggregations
- Indexed columns on frequently queried dimensions
Caching Strategy
- Redis for hot data (current hour metrics)
- Application-level caching for computed aggregations
- CDN caching for dashboard API responses
Horizontal Scaling
- Worker pools for parallel processing
- Queue-based architecture for handling traffic spikes
- Auto-scaling based on queue depth and CPU usage
Real-World Impact
This ETL system powers dashboards used by:
- Call center managers tracking team performance
- Customer success teams identifying at-risk accounts
- Product teams analyzing feature adoption through call patterns
- Executive leadership monitoring overall customer satisfaction
The data pipeline processes millions of data points daily, providing real-time insights that directly impact business decisions for some of the largest financial institutions in the US.
What I Learned
Building ETL pipelines at this scale taught me the importance of:
- Data quality over processing speed
- Monitoring as a first-class citizen, not an afterthought
- Graceful degradation when upstream systems fail
- Clear data lineage for debugging and compliance